or in pdf format here:evolution of air pollution monitoring in ottawa
Also discussed here: Ottawa Air Quality Information System(10 page pdf, Natividad Urquizo, Daniel Spitzer, William Pugsley and Martha Robinson, 44th Annual Congress of the Canadian Meteorological and Oceanographic Society, Ottawa, ON, May 29-June 4, 2010)
And here: Mapping Small Scale Air Pollution Distribution using Satellite Observations an a Large Canadian City(6 page pdf, Natividad Urquizo; D. Spitzer; W. Pugsley and M. Robinson, 11th Conference on Atmospheric Chemistry of the annual conference of the American Meteorological Society at Phoenix AZ, Jan. 12, 2009)
And here: Is Air Quality Affecting Your Health?(John Lorinc, UofT Magazine, Jan. 11, 2013)
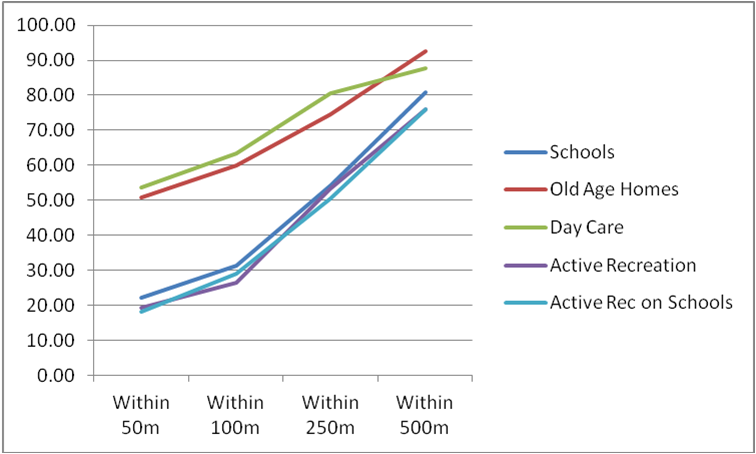
Today we review a paper presented at the biannual Upwind-Downwind Conference in Hamilton that describes the development of a fairly unique urban air quality program. The program was given a boost in 2007 by a project that combined satellite air quality data from space with observations from a dozen ground stations to produce maps at 10 km resolution at 10 minute intervals for a year over the national capital area (which includes the twin cities of Ottawa and Gatineau). Further applications of these data with real-time traffic flow data allowed for mapping down to the street level in downtown Ottawa and assessments of health impacts near these roads which showed that over 50% of schools and old age homes are located within 50 m of heavy traffic, placing the most vulnerable residents at risk from vehicle emissions. A new program has just been announced by the University of Toronto to examine similar applications of roadside emissions and health impacts in Canada’s largest city.
 Key Quotes:
Satellite AQ Pilot Project (2007-2008)
Key Quotes:
Satellite AQ Pilot Project (2007-2008)
- “Map pollution concentration spatially hour by hour to identify patterns (“hot spots”)
- One full year of monitoring (Jul’07-Jun’08) six major pollutants:Nitrogen oxides (NO, NO2, NOx), Ground Level ozone, Carbon Monoxide, Particulate Matter 2.5
- Three months of integrating satellite data and ground monitoring stations”
- Translate Air Quality maps from the pilot project (2008) into meaningful health impacts (morbidity, mortality and $$$)
- Use Air Quality Benefits Assessment Tool (AQBAT)
- Obtain a tool for health impact assessments of changing traffic flows”
Related articles


No comments:
Post a Comment