Monday, June 30, 2014

Another Use of SmartPhones to Monitor Traffic-Related Air Pollution (TRAP)

Measuring fine dust concentration via smartphone (ScienceDaily, Karlsruhe Institute of Technology, May 23, 2014)

Also discussed here: Enabling low-cost particulate matter measurement for participatory sensing scenarios (Abstract, Matthias Budde, Rayan El Masri, Till Riedel ,Michael Beigl, Proceedings of the 12th International Conference on Mobile and Ubiquitous Multimedia, Dec. 2, 2013)

And here:(2 min You-Tube, KIT Karlsruher Institut für Technologie, May 21, 2014)

Today we review PhD research from Germany that describes how a commercial off-the-shelf (COTS)dust sensor can be attached to a smart phone, making use of its camera to measure the scattering of light and estimate the concentration of particulate matter (PM10) with an accuracy of one microgram per cubic meter. Readings may then be transmitted via cell phone to a central point where a number of other phone measurements can be mapped in near real-time and add to the more sophisticated (and expensive) observations from the few government air quality stations.

 smart phone dust sensor

Key Quotes: 

"Detectors at the official measurement stations operated by the Baden-Württemberg State Agency for the Environment, Measurement, and Nature Conservation are very precise, but also very large, very expensive, and static. In Karlsruhe, for instance, only two measurement stations have been established,"

“This paper presents a mobile, low-cost particulate matter sensing approach for the use in Participatory Sensing scenarios. It shows that cheap commercial off-the-shelf (COTS) dust sensors can be used in distributed or mobile personal measurement devices at a cost one to two orders of magnitude lower than that of current hand-held solutions, while reaching meaningful accuracy”

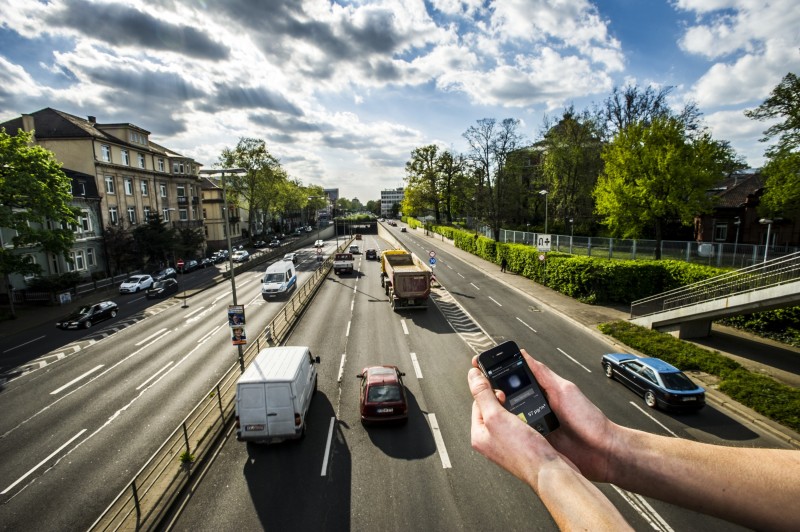
“The sensor is planned to be attached to the smartphone by means of a magnet… and the users take a photo or a video for measurement. The images can be evaluated locally or transmitted to a computer system that combines these data with other measurements and sends them back. Then, the fine dust concentration is displayed by the phone.”

"Instead of the conventional infrared LED in the sensor, the flashlight of the smartphone emits light into the measurement area. This light is scattered by the possibly existing dust or smoke. The camera serves as a receptor and takes a picture representing the measurement result. The brightness of the pixels can then be converted into the dust concentration,"

“the smartphone sensor can measure concentrations of about one microgram per cubic meter. This is sufficient for detecting coarse dust and smoke, but not for typical fine dust concentrations in the microgram range. The scientists now plan to further increase the sensitivity of the sensors.”

“the central idea of participatory sensing is the joint benefit resulting from an increased information quality -- which increases with the number of measurements.”

Friday, June 27, 2014

How Can We Find the Most Environmentally Sustainable Place in the World?

Construction of an environmental quality index for public health research (39 page pdf, Lynne C Messer, Jyotsna S Jagai, Kristen M Rappazzo, Danelle T Lobdell, Environmental Health, May 22, 2014) Today we review research aimed at developing a more accurate index of environmental quality than traditional indices used to select the greenest or healthiest or highest environmental quality of a place in the world. The older indices tend to use spot observations of a single indicator to represent an area or ambient value, and they tend not to consider a combination of several variables to evaluate land, air, water, built environment and socio-demographic conditions. An example of the latter is the difference in crime rates between urban and rural areas where the latter would feel safer and have a higher environmental quality than the former, all other variables constant. On the other hand, some urban areas have a better built environment (more bike and pedestrian paths, etc) than some rural areas where highway deaths are higher.

The proposed Environmental Quality Index (or EQI) uses 22 performance indicators to estimate environmental sustainability for all the counties in the USA. The resulting indices were weighted so that there were an equal number of regions at the low end as well as at the high end of the index scale. As the authors note, the EQI represents only the outdoor environment and indoor conditions may, on occasion, be more important from a health point of view or need to estimated from a different set of variables.

 env index 

Key Quotes:

“The empirical characterization of environmental conditions, however, is challenging because the non-residential ambient environment comprises an almost uncountable array of complex mixtures, which are difficult to quantify simultaneously… rarely, if ever, are multiple environmental domains combined, even though we know humans are exposed to these multiple environmental domains simultaneously”

“Here we describe a method of constructing an environmental quality index (EQI) representing multiple domains of the non-residential ambient environment, including the air, water, land, built and sociodemographic domains.”

“We developed an Environmental Quality Index for all counties in the United States incorporating data for five environmental domains: air, water, land, built, and sociodemographic. For each environmental domain, variables were constructed to represent exposures within that domain; indices for each domain and for environmental quality as a whole were developed by stratifying by rural–urban continuum codes. Variable loadings varied by domain and rural–urban designation, suggesting that environmental quality is driven by different domains in rural and urban areas.”

“The EQI is focused mostly on the outside environment, which may not be the most relevant exposure in relation to human health and disease.”

Wednesday, June 25, 2014

Warning Label: Driving a Car Could Harm your Health and the Health of the Planet

Climate Change & Air Pollution Warning Labels on Gas Pumps (42 page pdf,Our Horizon, 2013)

Also discussed here: Climate warning labels on gasoline may become a reality (Meredith James, Envirolaw, May 23, 2014)

And here: Can municipalities require climate warning labels on gasoline? (Dianne Saxe, Envirolaw, Sep. 3, 2013)

And here:

(11 min You-Tube, TEDxYouth, Havergal College, Toronto, 2013)


And here: Grade 10 student pitches global warming warning on gas nozzles (2 min video, Global BC News, May 15, 2014)

And here: Environmental group proposes warning labels on gas nozzles (Toronto Star, May 23, 2014)

Today we review a submission to Toronto City Council calling for a bylaw that would require gas stations to apply a climate change warning sign to their pumps. This follows the same rationale and municipal authority used for bylaws that ban idling which also was aimed at reducing needless vehicle emissions, as well as the health justifications used by municipalities for banning smoking inside restaurants and bars and city buildings, as well as near their entrances. Just as the tobacco companies fought smoking bans and health warning signs on cigarette packages, so the oil industry is likely to fight this proposal- with hopefully the same result. A similar bylaw is being proposed in West Vancouver and Hudson. Why not in other cities where vehicle emissions are a major greenhouse gas source and health risk?

    cl ch warning signs 

Key Quotes:

“Drivers fill their tanks each day in municipalities across Canada, and burn their gasoline driving within those municipalities. Canadians are, per capita, among the world’s worst GHG emitters, and the transportation sector is the largest contributor to our GHG emissions

“Under the various Municipal Acts across Canada, municipalities have substantial powers to license and regulate local businesses. Some municipalities already use this power to license service stations.”

“a carefully crafted climate change warning label by-law should survive legal attack, if it does not conflict directly with a federal or provincial law, is intended to complement provincial regulations and has a valid municipal purpose”

“The preamble from numerous municipal anti-idling by-laws reference greenhouse gas emissions, climate change, and local air quality. Implicit in these ubiquitous by-laws is an accepted recognition of vehicular emissions as a matter of local concern. The rationale behind our labelling by-law is identical. “

“Municipalities in Ontario can require gasoline retailers to place these labels on their gas pump nozzles. The warning labels would be a new condition for a gasoline retailer to obtain, continue to hold or renew its business license. The Municipal Act provides the authority to require such labels through its Part II general municipal powers and its Part IV licensing powers. The City of Toronto Act provides similar powers. These powers are broad and have been recognized by the Ontario Court of Appeal to empower municipalities “to tackle the challenges of governing in the 21st century.” “

 “The warning labels address some of the root problems of climate change and air pollution. First, they counteract the current moment bias by building feedback. Second, they address the problem of diffusion of responsibility by showing impacts right in the palm of our hand. Third, they capture and communicate negative externalities in a qualitative way. “

Monday, June 23, 2014

How do Lower Speed Limits Save Lives?

Dangerous by Design 2014 (48 page pdf, Smart Growth America - National Complete Streets Coalition, May 20, 2014)

Also discussed here: Paris to limit speeds to 30 km/hr over entire city (World Streets: The Politics of Transport in Cities, May 21, 2014)

And here: Oops! What went wrong with "Old Mobility" (World Streets: The Politics of Transport in Cities, Jun. 6, 2010)

Today we review a report from a non-governmental organization which aims to make streets safer for everyone, but particularly children and seniors. Children cannot see cars coming when travelling at more than 20 mph and, because they are small, drivers cannot see them either, making this segment of our population vulnerable. Seniors and those who have difficulty walking quickly are killed by cars at almost twice the rate as their part of the population (21% vs 12.6 %). Speed kills and many arterial roads encourage speeding – the risk of death of hit by a car moving at more than 50 mph is 75% while that drops to 6% at 20 mph.

Streets can be designed to protect pedestrians- by removing lanes, by giving pedestrians clearly marked areas to cross, by enforcing reduced speed limits. The Mayor of Paris, France proposes to forbid driving above 30 kph (about 20 mph) on all city streets, with a few exceptions, which tells you two things: first, their society is aging faster than in US/Canada and, second, the city fathers (or in this case mother) put a greater priority on pedestrian safety then on motorized mobility (the French call that “the old mobility”).

 france-zone-de-rencontre-street 

Key Quotes:

“At 20 mph, the risk of death to a person on foot struck by the driver of a vehicle is 6 percent. At 30 mph, that risk of death is three times greater. And at 45 mph, the risk of death is 65 percent—11 times greater than at 20 mph. When struck by a car going 50 mph, pedestrian fatality rates are 75 percent and injury rates are more than 90 percent“

“Where the posted speed limit was recorded, 61.3 percent of pedestrian fatalities were on roads with a speed limit of 40 mph or higher. This figure compares to just 9 percent of fatalities that occurred on roads with speed limits less than 30 mph.”

“The majority of pedestrian deaths occur on arterial roadways, planned and engineered for speeding automobiles with little consideration for the diversity of people—young, old, with and without disabilities, walking and bicycling—who rely on these streets to get them from point A to point B.”

“The nation’s older population will nearly double in size in the next 30 years. The number of racial and ethnic minorities is also projected to grow significantly. These groups, along with children, are disproportionately represented in pedestrian deaths.”

 “The most common cause of traumatic brain injury for children aged 5 to 9 is pedestrian injury… A recent study of perceptions of children aged 6 to 11 found that they lack the ability to detect vehicles moving faster than 20 mph. They don’t see the cars coming”

“While comprising 12.6 percent of the total population, adults aged 65 and older account for nearly 21 percent of pedestrian fatalities nationwide from 2003 to 2010.. For those 75 and older, pedestrian fatality rates are even more alarming, with 3.96 fatalities per 100,000 capita.15 People aged 75 years and older account for six percent of the total U.S. population, but more than 12 percent of pedestrian fatalities.”

“Generally, designing for safe, walkable communities begins with understanding how people use— and want to use—streets and public spaces to access destinations. From there flow general considerations such as separate people walking from people driving vehicles; keep traffic speeds low; ensure all sidewalks and curb ramps are accessible to people with disabilities; and clarify where each road user should be expected to travel.”

 “The just-elected new Mayor of Paris, Madame Anne Hidalgo, has prepared a revolutionary sustainable mobility project whereby virtually all of the streets of the city will be subject to a maximum speed limit of 30 km/hr….The only exceptions in the plan are a relatively small number of major axes into the city and along the two banks of the Seine

Friday, June 20, 2014

How Does Milan, Italy Reduce Traffic Congestion and Pollution- and Win an Award for it?

Ecopass program aims at reducing traffic conge...
Ecopass program aims at reducing traffic congestion and pollution in the city centre (Photo credit: Wikipedia)

Also discussed here: City of Milan wins prestigious transport award (talya.enriquez, Partnership on Sustainable Low Carbon Trasnport (SloCaT), 20 May 2014)
 
Today we review an award to the City of Milan for its successful implementation of a road pricing system in 2012 in its core urban area which resulted in 28% less traffic congestion, significantly less vehicle emissions (CO2 -35%, NOx -18%, PM10 -18%) as well as 10 M Euros/yr for improving alternative transportation modes, such as public transit and bike sharing. A key aspect for this project was the degree of public consultation which produced almost 80% positive support from the public for congestion charging at the onset, a much higher level than what was seen in other cities with congestion pricing schemes such as London, Stockholm and New York City.


Key Quotes: 

“it was concern for the levels of pollution (rather than congestion) that initially led to the introduction of the ‘Ecopass’ scheme in 2008….. the scheme was upgraded to a congestion charge in 2012, following the results of a city-wide referendum in which 79.1% of voters demanded both an upgrade and an extension of the Ecopass area.. the new city administration has recently implemented a monitoring system for Black Carbon, a new PM metric that is more suitable to prove the effectiveness of traffic restrictions.” 

“Milan therefore is the only city which can boast two types of road pricing measures, pollution charge and congestion charge, making Milan a reference point for those cities aiming to implement solutions for sustainable mobility and traffic regulation policies.”   

Area C is the restricted traffic zone in the Milan's center. The area subject to the congestion charge is called Cerchia dei Bastioni, a Limited Traffic Zone (LTZ) of 8.2km2… The access is limited on Monday, Tuesday, Wednesday and Friday from 7.30 to 19.30, and Thursday from 7.30 to 18. Cars entering Area C are detected by a system of 43 electronic gates”  

 “The overall goals of the Area C are: 
  • Decreasing vehicular access to the Area C; 
  • decreasing traffic congestion; 
  • reducing travelling time of private transport; 
  • improving public transport networks; 
  • decreasing the demand for public space occupation for on-street parking; 
  • reducing road accidents; 
  • reducing pollutant emissions caused by traffic; reducing the health risk related to the air pollution; 
  • increasing the share of sustainable modes of travel; 
  • improving the quality and the attractiveness of the urban center; 
  • raising funds for the development of soft mobility infrastructures: cycle lanes, pedestrian zones, 30kph zones.”   

"Some achievements: 
  • Decreasing traffic congestion: -28% 
  • Reducing pollutant emissions caused by traffic; Less emissions of pollutants: Total PM10 -18% ; Exhaust PM10 -10%; Ammonia -42%; Nitrogen Oxides -18%; Carbon Dioxide -35% 
  • Reducing the health risk related to the air pollution: Less Black Carbon (BC): -52% (Sept 2013) and -32% (Oct 2013) of BC concentration inside Area C compared to the outside Area C stations 
  • Raising funds for the development of soft mobility infrastructures: cycle lanes, pedestrian zones, 30kph zones:..incomes from Area C have been reinvested in projects for sustainable mobility: 10 million € for the strengthening of public transport in order to improve its frequency and 3 million € for the development of 2nd phase of bike-sharing system.” 

Wednesday, June 18, 2014

Are Tolls a Better Way to Pay for Road Infrastructure than Taxes?

The Free Ride Is Over: Why Cities, and Citizens, Must Start Paying for Much-Needed Infrastructure (34 page pdf, Philip Bazel and Jack Mintz, Research Paper, The School of Public Policy, University of Calgary, May 20, 2014)

Also discussed here: Cities should embrace user fees to fund repairs to aging infrastructure: Report (Manisha Krishnan, Calgary Herald, May 20, 2014)

 Today we review a report that analyses why user fees for municipalities are not applied to roads but are happily applied to other forms of public infrastructure such as public transit, waste and water drainage. The costs of road infrastructure tends to come from transfers from the federal or provincial levels (which as a revenue stream has been rising) or from property taxes with very little outside of gas taxes from the users.

The result is that local politicians are shielded from accountability for the condition of roads and, as it affects property taxes which are higher in the urban core, people tend to accept commuting longer distances to buy cheaper properties in the suburbs - which only celebrates urban sprawl and congested highways leading into the cities. It also disadvantages those affected by the added congestion whether it is added congestion from the suburbs or the environmental and health costs borne by those living downtown. Other countries regularly charge road users for roads and bridge infrastructure.

As this report concludes: “To the detriment of their infrastructure, cities across Canada have made insufficient use of user pricing. It is time for a change.” road user fees 

Key Quotes:

“Municipalities, facing increasingly high bills to repair and replace roads, bridges, and water systems, are too reliant on provincial and federal government subsidies, according to the report… now make up 40 per cent of municipal budgets, a 15 per cent jump over the last 50 years…..Such subsidies lower the political costs for local governments allowing municipalities to maintain artificially low taxes for their constituents by spending federal or provincial tax revenue.”

“Increased reliance on property taxes and other tax bases unrelated to infrastructure costs potentially hollow out the inner city as people and businesses move to other nearby towns with lower taxes, while still using subsidized roads and transit to commute into the city.”

“Greater reliance on infrastructure pricing would also provide two other major benefits. It would impose a higher standard on local spending decisions and it would contribute to accountable decision-making, by creating a direct link between the localized costs that users face for infrastructure and the quality of services that they receive.”

 “Though user fees are prevalent for public transit, water and waste, Canadian municipalities …have largely refused to embrace road and congestion tolling, or adopt a larger base for user-pay models to fund new projects, maintenance or additional capacity for existing infrastructure. Aside from international crossings, Canada had only eight tolled bridges in 2012, and less than 0.25 per cent of Canada’s paved public roads were tolled”

“Roads, streets, walks and lighting are highly subsidized, with taxpayers covering roughly 85 per cent of revenues, followed by storm sewers and drainage…About 40 per cent of transit operational revenues are taxpayer funded….About one third of water-supply and waste-treatment operation revenues come from taxpayers in Edmonton,”

 ” When governments do not price infrastructure to charge households for the marginal costs associated with their commuting, households will be willing to live further away from the core.… this causes housing prices to rise further from the city core, while housing prices fall near the city centre. This leads to urban sprawl as rural areas at the city’s edge are converted into urban residence. Inefficiency is introduced whereby a greater share of the population is more willing to live near the city limits furthest away from a city core, thereby leading to more commuting than would occur if full user-fee pricing were in place."

“The social costs associated with commuting also include environmental costs, accident externalities and transit-service crowding costs.”

Monday, June 16, 2014

How Can Exhaust from Air Conditioning be used More Effectively?

Image of Atlanta, Georgia, showing temperature...
Image of Atlanta, Georgia, showing temperature distribution, with hot areas appearing white (Photo credit: Wikipedia)
 Anthropogenic Heating of the Urban Environment due to Air Conditioning (F. Salamanca, M. Georgescu, A. Mahalov, M. Moustaoui and M. Wang, Journal of Geophysical Research: Atmospheres, Mar. 6, 2014) 


Today we review research carried out in Phoenix, Arizona to assess the impact of air conditioning on the urban heat island. Results indicate that air conditioning increases the mean air temperature by 1 deg C and that air conditioning consumes more than 50% of electricity used during extreme heat events. Instead of simply exhausting this heat into the atmosphere, the report recommends that it could be used for useful activities inside the house such as water heaters which could result in savings of at least 1200 MWh per day for the city. Continued climate warming will make this an even bigger issue affecting not only the formation of smog from ozone and excessive heat. Redirecting the exhaust heat offers the possibility of reducing electrical usage which itself is produced by the burning of carbon fuels which accelerate climate warming.  

Key Quotes: 

“We found that waste heat from air conditioning systems was maximum during the day but the mean effect was negligible near the surface. However, during the night, heat emitted from air conditioning systems increased the mean air temperature by more than 1 degree Celsius (almost 2 degrees Fahrenheit) for some urban locations,” 

 “air conditioning (AC) systems can consume more than 50 percent of total electricity during extreme heat and put a strain on electrical grids.” 

“hot summer nights will lead to increased air conditioning demand, which in turn will output additional waste heat into the environment, leading to further increase in AC demand, resulting in a positive feedback loop.” 

“the effect of the AC systems was more important during the night due to the limited depth of the urban boundary layer. The effect is stronger from late afternoon to early morning. A smaller quantity of excess AC systems heat ejected during the night can increase the air temperature more compared to a greater quantity released during the daytime when the hot sun is beating down.”

“Our work demonstrates one Celsius degree (almost 2 F) local heating of urban atmospheres in hot and dry cities due to air conditioning use at nighttime. This increase in outside air temperature in turn results in additional demands for air conditioning," 

“optimization of electricity consumption in cities would require turning ‘wasted heat’ from AC into ‘useful energy’ which can be utilized inside houses for various purposes including, for example, water heaters” 

“for the Phoenix metropolitan area that successfully reducing the urban heat island temperature with this strategy would result in at least 1200-1300 MWh of direct energy savings per day alone.”